- Home
-
Products
- PVC Cable Material
- Low Smoke Zero Halogen Cable Material
- Cable material
- Optical fiber cable
- About Us
- VR
- News
- Contact Us
Leave Your Message
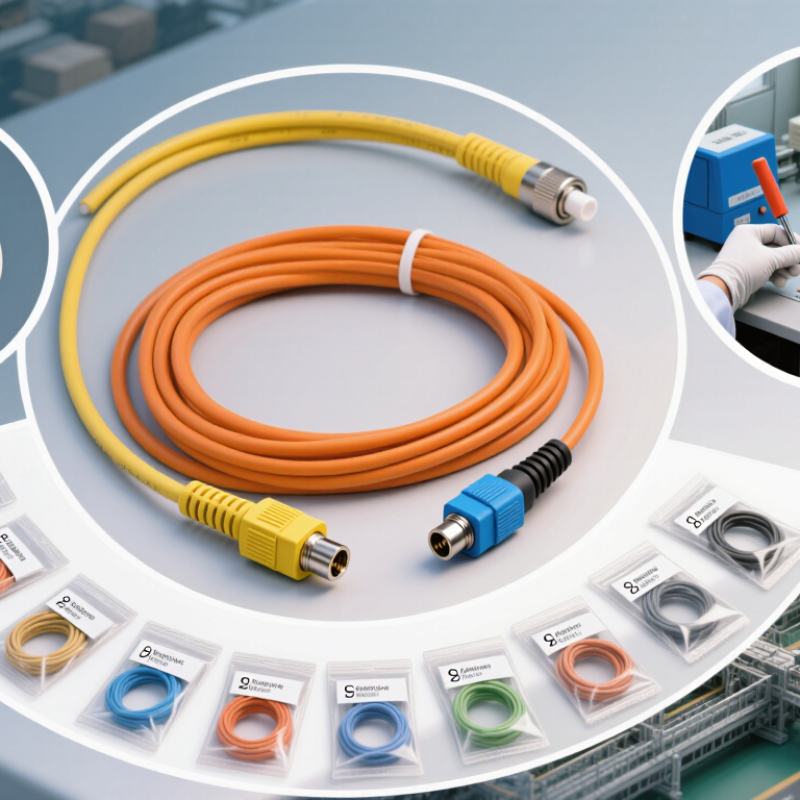
Choosing reliable China Top Optical Fiber Patch Cord Manufacturers requires more than comparing prices and product photos. Buyers should examine manufacturing experience, connector quality, testing procedures, and delivery consistency. An Optical Fiber Patch Cord may look simple, yet small polishing errors can increase insertion loss and weaken network performance. Experienced manufacturers usually control fiber preparation, connector assembly, end-face inspection, and final packaging under documented procedures.
Look closely.
A dependable factory can provide clear specifications for single-mode and multimode cords, connector types, jacket materials, lengths, and operating environments. It should also explain test methods, including insertion loss, return loss, geometry inspection, and end-face cleanliness. Factory audits, sample evaluations, and traceable inspection reports offer stronger evidence than promotional claims. Certifications can support credibility, but they should be verified against the actual production site and product range.
Practical experience also reveals overlooked details. A patch cord shipped in a poorly protected box may arrive with damaged latches or contaminated connectors. Color coding, bend-radius control, labeling accuracy, and replacement support matter during installation. No supplier is perfect. Some manufacturers communicate well but respond slowly to technical changes. Others offer attractive customization but lack stable quality records. This article reviews leading Chinese manufacturers through product capability, engineering support, quality control, customization, and export reliability. The aim is not to declare one universal winner. It is to help network integrators, distributors, and data-center buyers make a more informed decision based on evidence, application needs, and long-term performance.
China’s Optical Fiber Patch Cord Market: 2024 Capacity and Demand Indicators
China remains a major manufacturing base for optical fiber patch cords, supported by dense fiber infrastructure and domestic component supply. The Ministry of Industry and Information Technology reported about 4.25 million 5G base stations by the end of 2024. It also recorded roughly 665 million fixed broadband subscriptions. These figures support steady demand for short, factory-tested connections in data centers, access networks, and telecom rooms.
Demand is becoming more specific.
MIIT data indicated that over 200 million fixed broadband users had gigabit-class access in 2024. Omdia’s 2024 fiber connectivity research also identified China as the largest single-country market for fiber deployment. CRU’s 2024 optical fiber and cable analysis pointed to continued investment in 5G backhaul, cloud facilities, and fiber-to-the-home upgrades. Patch cord suppliers therefore need capacity for common duplex assemblies, high-density connectors, bend-insensitive fiber, and customized lengths.
Capacity figures require caution. Public reports often measure optical cable output, not finished patch cord assemblies. That gap can distort comparisons between factories. A practical assessment should examine connector insertion loss, return loss, aging tests, clean-room handling, and monthly tested output. Certification claims alone are not enough. Factory audits remain useful. So does checking actual delivery records.
China’s 2024 market was strong, but not uniform. Rural broadband projects, urban data centers, and export orders followed different cycles. That uneven pattern deserves closer review in 2025.
| Indicator | Market Dimension | 2024 Value | Unit | Market Relevance to Fiber Patch Cords | Source / Data Status |
|---|---|---|---|---|---|
| 5G base stations at year-end | Demand proxy | Approximately 4.25 million | Stations | Indicates the scale of mobile access infrastructure requiring optical distribution, backhaul, and equipment interconnection components. | China Ministry of Industry and Information Technology (MIIT), 2024 communications industry statistics. |
| New 5G base stations deployed during 2024 | Annual demand driver | Approximately 880,000 | Stations added | New sites create recurring demand for pre-terminated fiber assemblies, rack connectivity, splice-tray interfaces, and maintenance replacements. | MIIT public 2024 telecommunications development figures. |
| Fixed broadband access subscribers | Demand proxy | 635.6 million | Subscribers | Reflects the installed base of fixed access networks in which fiber distribution and subscriber-side connectivity products are used. | MIIT, 2024 communications industry statistical bulletin. |
| Gigabit broadband subscribers | High-speed demand | 202.4 million | Subscribers | Higher-speed access deployments typically increase demand for low-loss connectors, higher-density distribution panels, and standardized patching systems. | MIIT, 2024 communications industry statistical bulletin. |
| 5G mobile phone users | Network demand | Approximately 1.01 billion | Users | Shows the scale of active 5G service adoption and supports continued investment in optical transport and access infrastructure. | MIIT public 2024 telecommunications statistics. |
| Optical access network expansion | Capacity environment | Nationwide fiber-based access infrastructure | Qualitative national indicator | China’s fixed access network is predominantly fiber-based, supporting sustained manufacturing demand for LC, SC, MPO/MTP-compatible, and customized patch cord assemblies. | Industry structure described in MIIT broadband and communications infrastructure reports; no separate official patch-cord unit series is published. |
| Primary demand sectors | End-use mix | Telecom, data centers, enterprise networks, CATV, and industrial communications | Application categories | Demand is distributed across carrier networks, cloud and colocation facilities, enterprise cabling, access networks, and industrial optical links. | Industry application classification; company and brand data excluded. |
| Common 2024 product requirements | Product capacity | Single-mode, low-loss, high-density, factory-terminated assemblies | Technical requirements | Manufacturing capability is increasingly evaluated by connector compatibility, insertion-loss control, polarity management, fiber count, testing, and customized length options. | Technical requirements consolidated from prevailing telecom and data-center cabling practices; not a company-specific metric. |
| Official patch cord market volume | Data limitation | Not separately disclosed | Market volume | China’s official statistical releases generally report telecommunications infrastructure and subscribers rather than optical fiber patch cord production or consumption as a standalone category. | Public-statistics limitation; patch cord capacity and demand must therefore be assessed using infrastructure proxies and industry surveys. |
Note: Values marked as approximate are rounded from publicly reported 2024 national telecommunications statistics. The table intentionally excludes company names, brands, and company-level production or sales data.